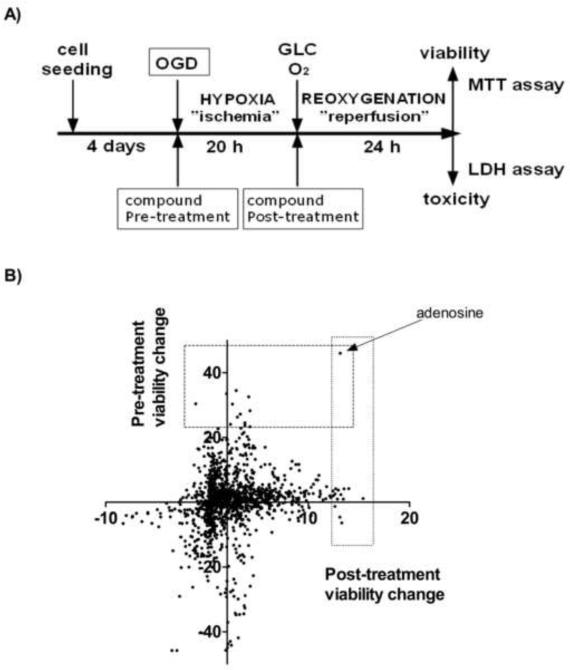
Figure 4. The experimental design of the screens and the compound-induced viability changes in the assays.
LLC-PK1 proximal tubule cells were grown to form confluent monolayer and then subjected to OGD for 20 hours to mimic ischemia. Reperfusion injury was imitated by glucose and oxygen re-supplementation for 24 hours, then the cell survival was evaluated by the MTT and LDH assays. Test compounds were screened for cytoprotection by treating the cells either prior to the OGD (“Pre-treatment”) or following the OGD (“Post-treatment) (A). The viability changes induced by the compound treatment are shown as percent values compared to the vehicle treated cells (zero value) on the dot plot. The effect of the post-treatment is shown on the x axis and the changes in the pre-treatment screen are represented on the y axis (B). The screens were performed in replicates and the average values are shown.

