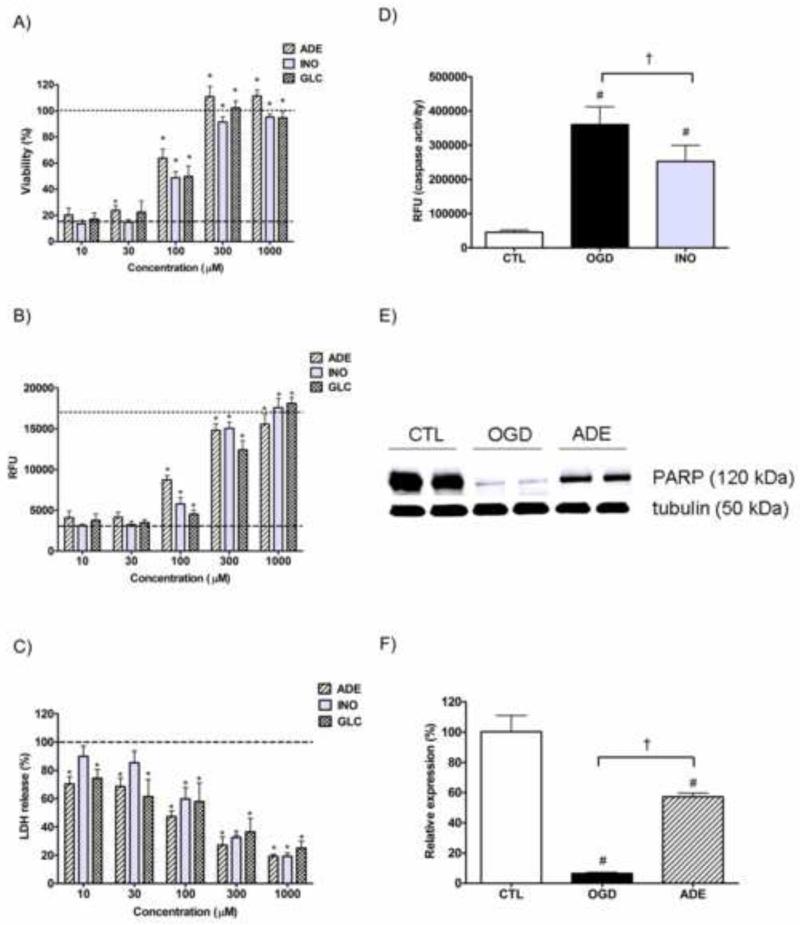
Figure 5. The protective actions of adenosine and inosine against the OGD induced proximal tubule injury.
LLC-PK1 cells were subjected to 20 hour-long OGD in presence of the indicated concentration adenosine, inosine or glucose and then re-supplemented with glucose and oxygen for 24 hours. The viability was measured by the MTT (A) and alamar blue (B) assays, the LDH release was evaluated by measuring the LDH activity in the supernatant (C). The viability value of the OGD group is labeled with the dashed line, and the CTL viability is shown as dotted line. The decrease in LDH release is shown as percent value of the LDH activity of the vehicle treated cells (OGD). Cells were subjected to 20 hour-long OGD with the absence (OGD) or presence of 100 μM inosine (INO) and caspase-3 activity was measured after 8 hours of reoxygenation. Caspase-3 activity was measured with fluorescent substrate and relative fluorescence (RFU) values of the cleavage product are shown (D). Cells were subjected to 20 hour-long OGD with the absence (OGD) or presence of 300 μM adenosine (ADE) and the amount of full-length PARP-1 was evaluated by Western blotting (E and F). Representative blot of PARP-1 and normalization signal tubulin (E) and results of the densitometric analysis (F) are shown. The bar graph represents the PARP-1 (120 kDa) signal normalized to tubulin as relative PARP-1 expression compared to the CTL. (Data are shown as mean ± SD values, *p<0.05 compared to OGD #p<0.05 compared to CTL, †p<0.05 compared to OGD group).

