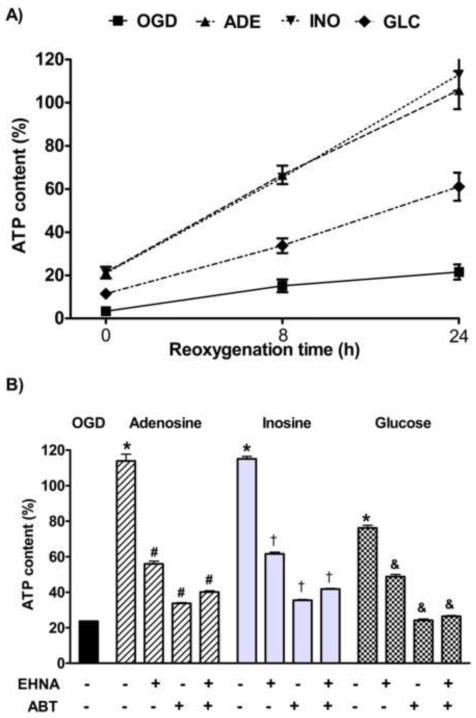
Figure 8. The posthypoxic ATP content of the cells after purine nucleoside supplementation and the effect of ADA and AK inhibition on the recovery.
LLC-PK1 cells were subjected to 20 hour-long hypoxia in the absence (OGD) or presence of 300 μM adenosine (ADE), inosine (INO) or glucose (GLC), then re-supplemented with glucose and oxygen and incubated up to 24 hours. The ATP content was determined at the indicated reoxygenation time and expressed as percent values of control cells (A). After the hypoxia the cells were also treated with ADA inhibitor EHNA (10μM) and/or AK inhibitor ABT 702 (ABT, 30μM) and the ATP content was measured after 24 hours (B). (Data are shown as mean ± SD values. *p<0.05 compared to OGD, #p<0.05 compared to adenosine, †p<0.05 compared to inosine, &p<0.05 compared to glucose.)

