
Figure 2.
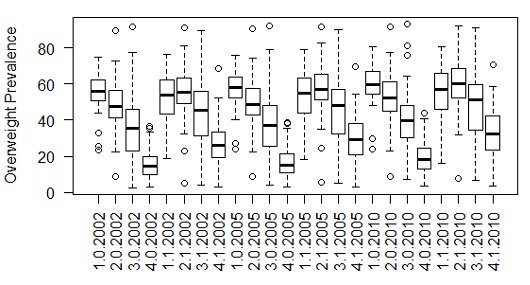
Boxplots of overweight prevalence by HDI level, sex, and year. The horizontal axis labels are in the form: Human Development Index (HDI) level (1 for very high, 2 for high, 3 for medium, 4 for low), indicator for sex (1 for female, 0 for male), and year.