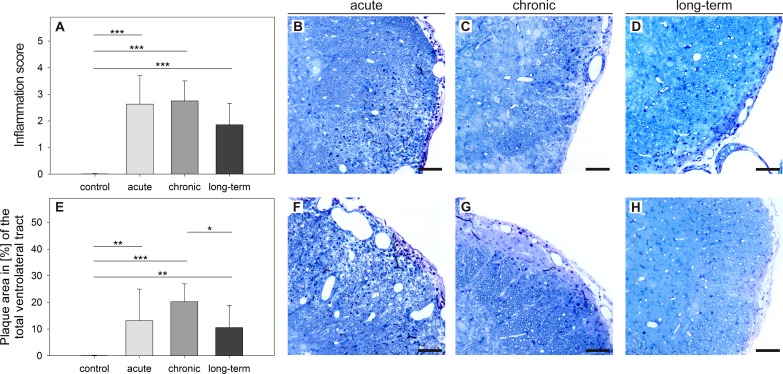
Fig 2. Time-dependent alterations of inflammation and lesional area in MP4-induced EAE.
Semi-thin sections of the VLT were obtained from B6 mice in acute EAE, three months (chronic) and six months after EAE onset (long-term). Sections were stained with methylene blue and compared to a non-immunized control group that consisted of n = 10 mice. Cellular infiltration (A) was graded on a semi-quantitative scale and the lesional area size was measured (E). The means ± SD are shown for a total number of n = 7 mice in the acute, n = 5 mice in the chronic and n = 10 mice in the long-term stage of EAE. Representative images from every stage of the disease are displayed showing cellular inflammation (B-D) and the lesional area (F-H). *p ≤ 0.05; **p ≤ 0.01; ***p ≤ 0.001. Scale bars depict 50 μm.

