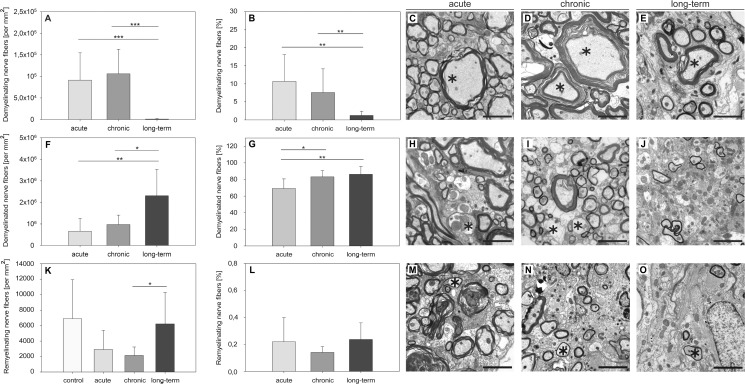
Fig 3. Differences in myelin pathology in the course of MP4-induced EAE.
Ultra-thin spinal cord sections were obtained from MP4-immunized B6 mice in different disease stages and images were taken from the center of the lesional area in the VLT. The numbers and percentages of nerve fibers being either in the process of demyelination (A, B), completely demyelinated (F, G) or remyelinated (K, L) were evaluated. Values obtained from non-immunized control mice were subtracted for the nerve fibers being in the process of demyelination and for completely demyelinated nerve fibers. The means ± SD are demonstrated for a total number of n = 7 control mice, n = 7 mice in the acute, n = 5 mice in the chronic and n = 10 mice in the long-term stage of the disease. Representative images from every stage of EAE depicting demyelinating (C-E), demyelinated (H-J) or remyelinating nerve fibers (M-O) are displayed. *p ≤ 0.05; **p ≤ 0.01; ***p ≤ 0.001. Scale bars depict 10 μm.

