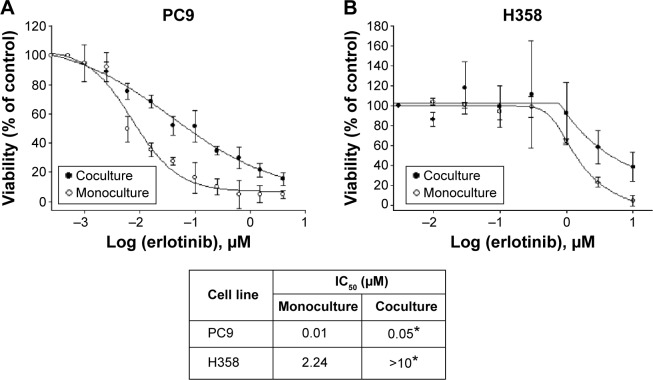
Figure 1.
Dose–response viability curves of human NSCLC cell lines PC9 (A) and H358 (B).
Notes: In direct coculture, 30,000 CAFs and 7,500 cells expressing GFP were plated in a 24-well plate and treated with different concentrations of the EGFR TKI erlotinib for 72 hours. In monoculture, 7,500 NSCLC cells expressing GFP were used for viability assay. The IC50 values of these cell lines to erlotinib, together with the SD, are shown. Viability was determined by measuring the fluorescence intensity. Data are expressed as percentage of vehicle-treated control cells (taken as 100% cell viability). Each experiment was repeated at least two times in triplicate with similar results, and survival data from a representative experiment are shown fitted to a nonlinear sigmoidal model using Sigma plot. Values represent the mean ± SD of triplicate samples in one representative experiment. Significance in IC50 was determined by Student’s unpaired t-test. *P<0.05 versus monoculture.
Abbreviations: NSCLC, non-small cell lung cancer; CAF, cancer-associated fibroblast; GFP, green fluorescence protein; EGFR, epidermal growth factor receptor; TKI, tyrosine kinase inhibitor; SD, standard deviation.

