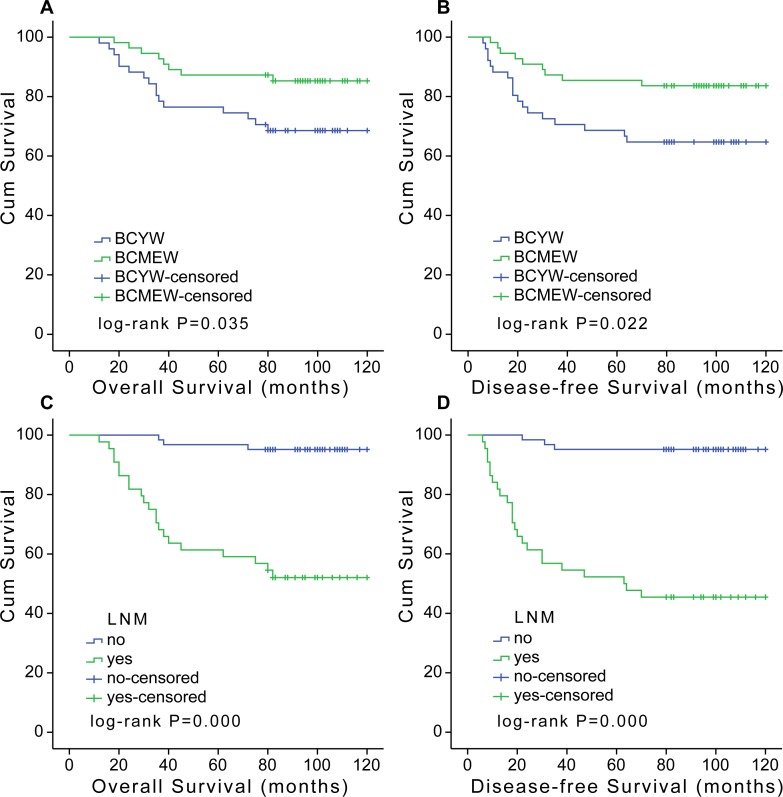
Fig 3. Kaplan-Meier OS (A and C) and DFS (B and D) curves.
(A) BCYW (age ≤35) had a significantly worse OS compared with BCMEW (age >40). (B) BCYW had a significantly worse DFS compared with BCMEW. (C) Breast cancer patients with LNM had a significantly worse OS compared to those without LNM. (D) Breast cancer patients with LNM had a significantly worse DFS compared to those without LNM.

