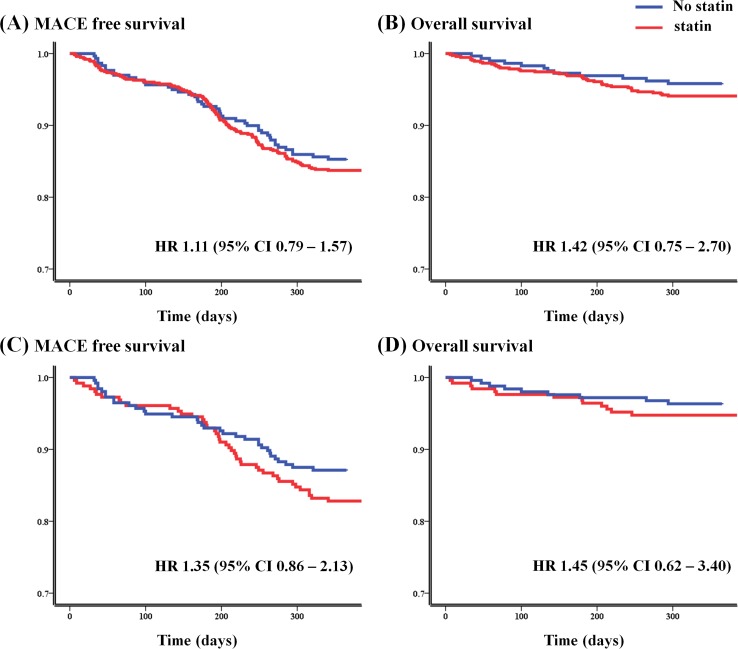
Fig 2. Event-free survival curves.
The Kaplan-Meier curves demonstrate no significant differences between statin and no-statin groups for either 12-month major adverse cardiovascular events (A, overall population; C, propensity-score matched population) or 12-month all cause mortalities (B, overall population; D, propensity-score matched population). MACE, major adverse cardiovascular event; HR, hazard ratio

