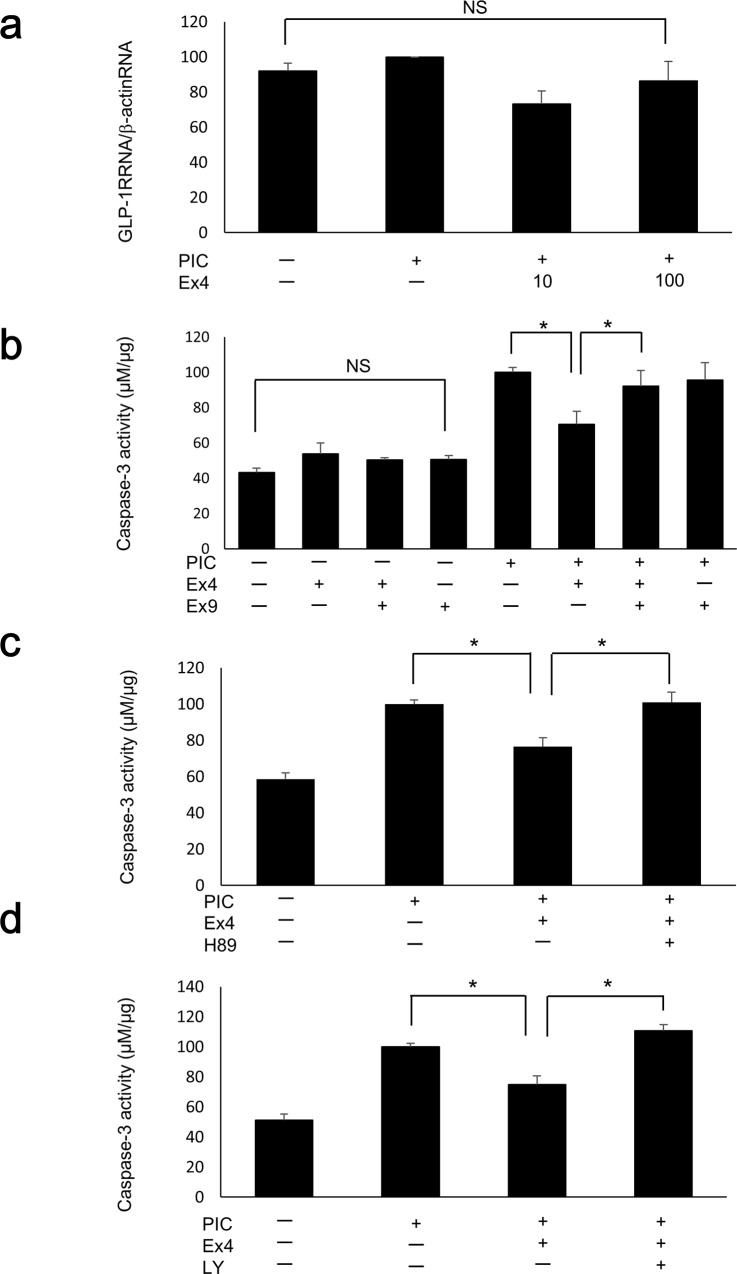
Fig 4. Ex4 mitigated PIC-induced apoptosis via the GLP-1 receptor and both the PKA and PI-3K pathways.
(a) Quantitative RT-PCR analysis of the GLP-1 receptor was performed in PIC-transfected MIN6 cells with or without Ex4 (10 nM and 100 nM, n = 3). The data were normalized to β-actin gene expression, with the relative gene expressions of the PIC-transfected cells arbitrarily set to 100. The error bars represent SE. (b–d) Caspase-3 activities of PIC-transfected MIN6 cells treated with 100 nM Ex4 and Ex9 (b), H89 (c), or LY294002 (d). The data are expressed as the caspase-3-to-protein content ratio, with that of the PIC-transfected cells without Ex4/Ex9, H89, or LY294002 arbitrarily set to 100. The error bars represent SE. The asterisk indicates significant difference (p<0.05). NS represents no significant difference.

