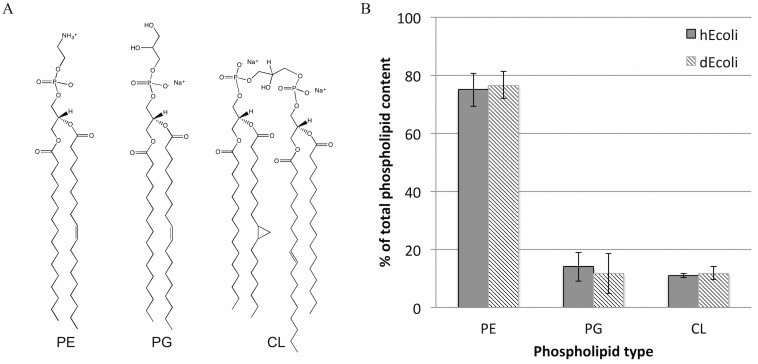
Fig 1. Lipid composition of total lipid extracts from hEcoli and dEcoli.
A: Molecular structures of the most abundant species detected by MALDI-TOF mass spectrometry (see S1 Fig). B: Phospholipid composition of hEcoli (solid bars) and dEcoli (striped bars). Results are the means ± S.D. from two independent experiments. PE, phosphatidylethanolamine; PG, phosphatidylglycerol; CL, cardiolipin.

