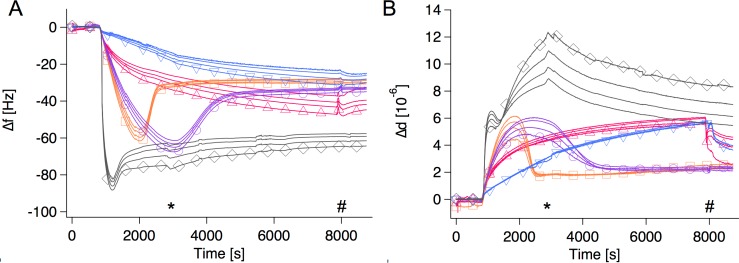
Fig 3. Selected QCM-D traces for bilayer formation, which were part of the optimization process.
A: frequency changes. B: dissipation changes. Several overtones are shown for each experiment; 5th, 7th, 9th and 11th. The 5th overtone carries the marker. SUVs made from Avanti E. coli total lipid extract were added to clean silica under different experimental conditions: blue down-pointing triangle: 100 μg/ml lipid, 1 mM CaCl2, orange square: 100 μg/ml lipid, 2 mM CaCl2, purple circle: 50 μg/ml lipid, 2 mM CaCl2, gray diamond: 250 μg/ml lipid, 2 mM CaCl2, pink up-pointing triangle: 100 μg/ml lipid, 2 mM CaCl2,–pump stopped after initial adsorption. The * indicates the point where trace number 4 was rinsed with buffer. The others were rinsed at the point marked with a #.

