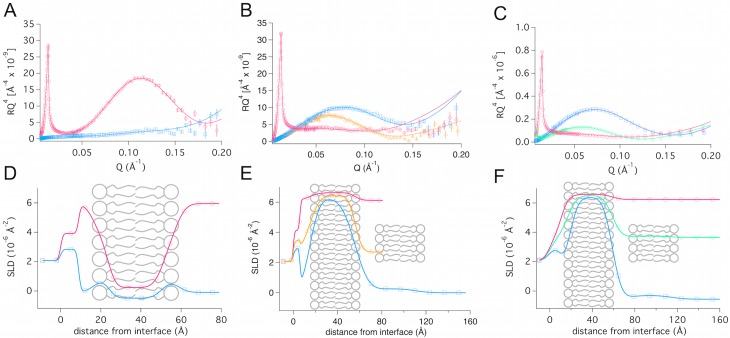
Fig 5. Neutron reflection intensity as a function of scattering vector, Q.
(A) hEcoli deposited at 50°C, (B) dEcoli deposited at 50°C and (C) dEcoli deposited at 25°C. The contrasts used are: H2O (blue squares), 40% D2O (yellow triangle pointing up) and 60% D2O (green down-pointing triangle) and pure D2O (pink circles). All reflectivity profiles were measured at 25°C regardless of deposition temperature. Panel D-F give the SLD profiles and bilayer sketches corresponding to the reflection curve above it. In E and F the small additional patch of bilayer to the right represents the extra bilayer of very low coverage, which is used as a model for a small amount of co-adsorbed vesicles. In E, this extra layer was only present in the first contrast (H2O) measured and, thus, only the blue SLD profile represents the extended model.

