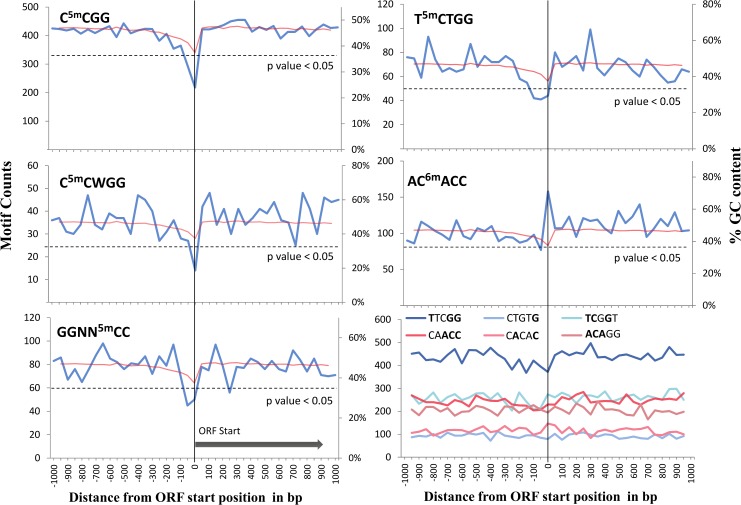
Fig 3. Depletion of cytosine methylated motifs in the immediate upstream region of ORFs.
Occurrence counts of five (most frequent) methylation target motifs are plotted against their position (in bp) relative to 1997 oriented ORFs (genome annotation N. meningitidis strain Z2491). Motif counts are presented as sum over all ORFs within 50 bp windows, centered at position zero. Red lines in each panel compare to the GC content percentage (y-axis label to the right), averaged over all ORF regions. Dashed horizontal lines represent the averaged motif occurrences corresponding to statistically significant (p value 0.05) depletion of the corresponding motif, derived from a comparison to equally sized sets of random loci. The lower right panel represents occurrence counts of a set of six non-methylated control motifs with similar base composition (identical positions in bold), and similar occurrence frequencies as the non-palindromic target motifs T5mCTGG and AC6mACC. None of the control motifs display significant depletions at ORFs comparable to that of methylated motifs.

