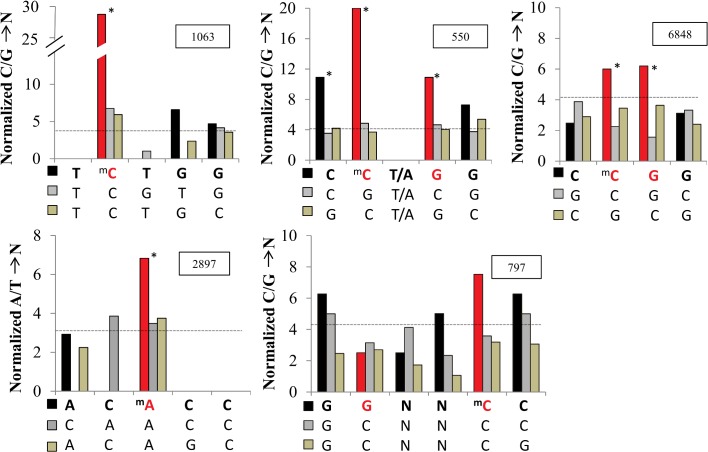
Fig 6. Methylated nucleotides display higher mutation rates than non-methylated positions.
Positional co-occurrences of (in total 6031) SNPs at positions within (methylation) target motifs. Methylated positions highlighted in red within five target motifs (bold), as detected in the present study, with, each compared to two similar control sequences. Black bars in histogram represent nucleotides in methylated motifs, gray shades represent sequences not known as DNA-methylation targets. For each motif, counts of overlapping SNPs (for 5m-cytosine motifs: C/G in reference →N; or for 6m-adenosine: A/T→N) at each position are normalized by the genome-wide motif occurrences (numbers for methylated motifs in inset box). The dashed lines indicate the corresponding number of SNPs expected from random occurrence (G/C or A/T) across the genome and over-representation was tested with the χ2 statistics (*p value < 10–5).

