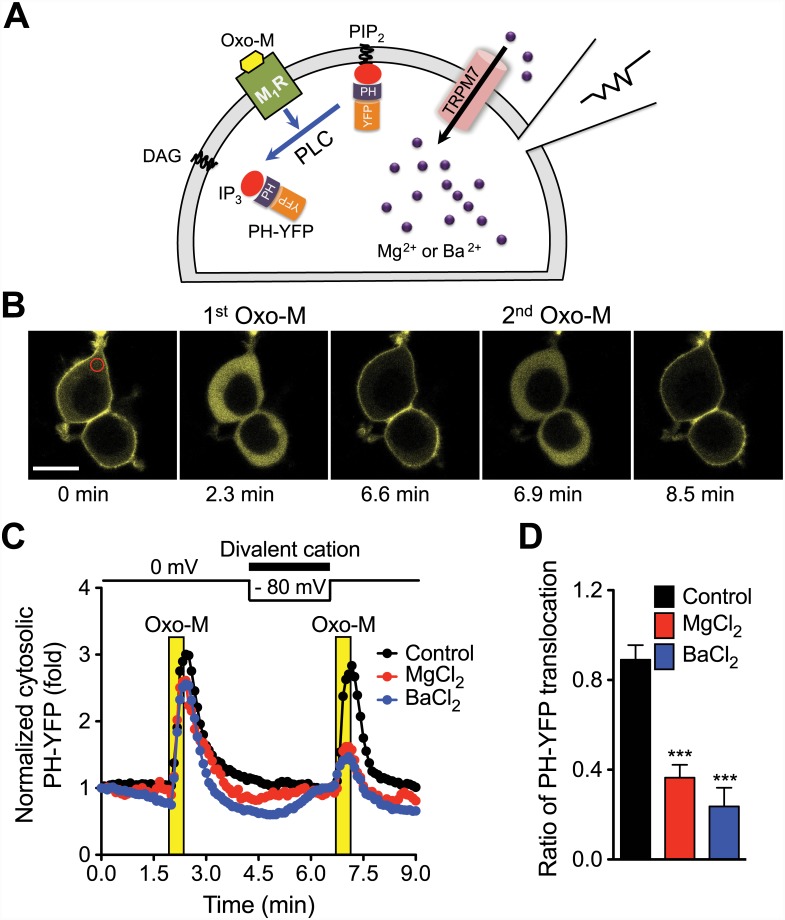
Fig 4. Inhibition of PIP2 hydrolysis by Mg2+ or Ba2+ accumulated into cells through TRPM7.
(A) Schematic diagram. HEK293-TRPM7 cells were transfected with M1R and PH-YFP and TRPM7 channels were activated by voltage clamp to accumulate divalent. (B) Confocal images of PH-YFP where the fluorescence is coded as yellow. Images are taken before and during application of 1 μM oxotremorine-M (Oxo-M) in control group. Top cell was patched. Region of interest (ROI) used for the PH-YFP translocation analysis is indicated in red circle. Black scale bar indicates 20 μm. (C) The average rate of PIP2 hydrolysis by PLC was estimated by the monitoring of translocation of PH-YFP into the cytosol upon activation of M1R with 1 μM Oxo-M. For the accumulation of divalent cations into the cells, external solutions containing 10 mM MgCl2 (N = 5) or 10 mM BaCl2 (N = 7) were perfused at the indicated time, and their influx through TRPM7 was triggered by a negative membrane potential (-80 mV). Error bars were omitted for clarity. (D) Comparison of PLC activity before and after the divalent accumulation. Percent increase of cytosolic PH-YFP upon 2nd Oxo-M treatment was divided by that of 1st Oxo-M (see Methods for details). The results are mean ± SEM and representative of two independent experiments. *** P < 0.001 compared to control group (N = 5).

