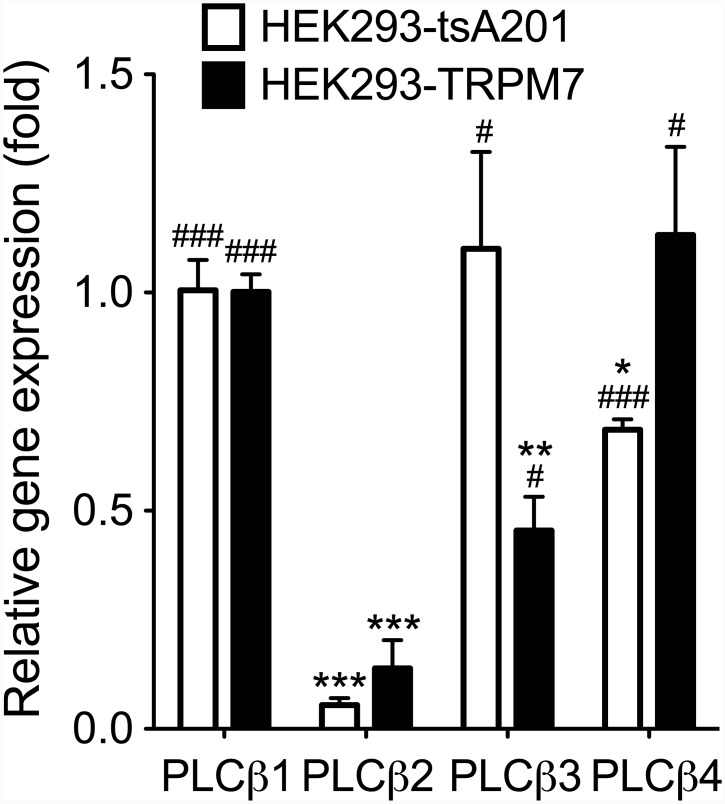
Fig 6. Expression of PLCβ in HEK293-tsA201 and HEK293-TRPM7 cells.
Expression level of PLCβ isoforms was analyzed with Q-PCR. Their mRNA levels were normalized to GAPDH and presented as relative to PLCβ1. n = 3 for each condition. * P < 0.01, ** P < 0.01, and *** P < 0.001 compared to PLCβ1 group. # P < 0.05 and ### P < 0.001 compared to PLCβ2 group.

