
Fig. 2.
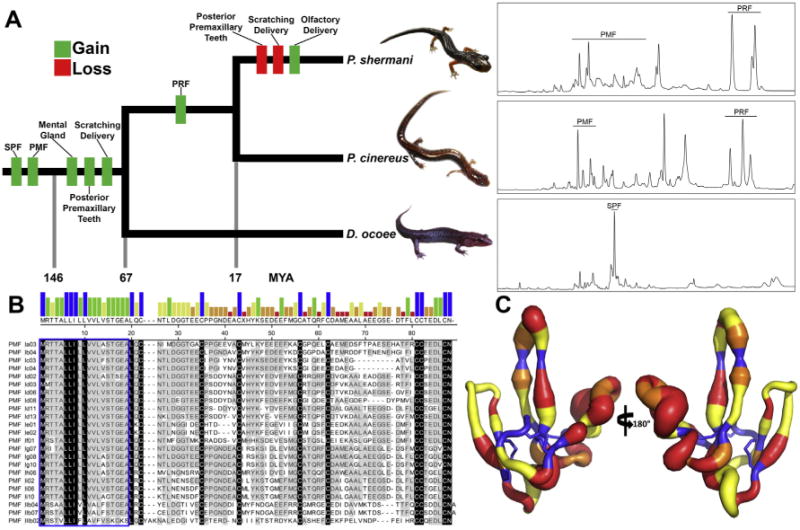
Summary of plethodontid pheromone evolution. (A) A reduced phylogenetic tree emphasizing species for which proteomic characterizations have been performed (P. shermani, P. cinereus, and D. ocoee). Approximate times in millions of years (MYA) for gain and loss of key morphological, behavioral, or genetic trait acquisitions are included, as well as representative reverse phase chromatograms for the pheromones of each species (using 70 minute gradients at 1% acetonitrile/min). While PMF is one of the oldest pheromone gene families, its expression varies dramatically between the three species, with D. ocoee expressing a single PMF isoform at extremely low abundance (<1% total pheromone, not visible by HPLC), P. cinereus expressing ∼4–6 isoforms, and P. shermani expressing >30 isoforms. (B) Alignment of PMF isoforms identified in the P. shermani pheromone extract by HPLC and MS-based proteomics (adapted from [109]). The bar graph shows consensus strength, the blue box highlights the signal peptide, and the few absolutely conserved residues (mostly the conserved eight cysteine core) are colored in black. (C) A putty model of the PMF 3D structure from [25], with backbone diameter representing residue heterogeneity (Shannon Weaver diversity index), and color signifying the mode of evolution (blue, purifying selection; yellow, neutral selection; orange, positive selection at >95% confidence; red, positive selection at >99% confidence).