
Fig. 3.
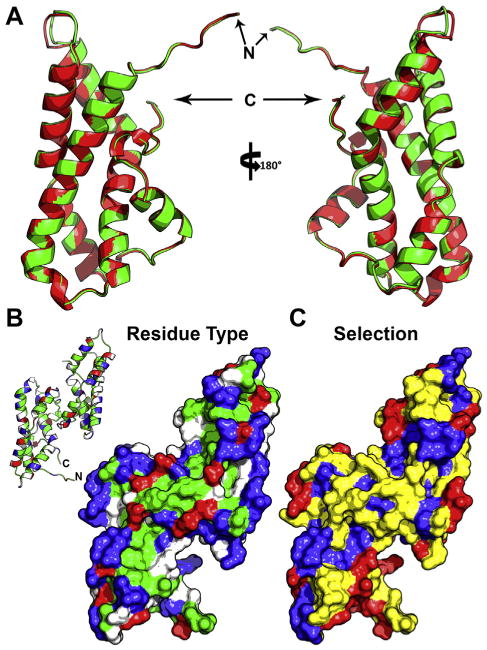
Structural models of abalone sperm lysin. (A) Backbone cartoon overlay of lysin crystal structures from two different species: red and green abalone (with ribbon color matching the species common name, and the N- and C-termini noted). The average backbone rmsd between the two models is ∼0.28Å.(B) Surface model of the red abalone lysin dimer, colored based on residue type (blue, basic; red, acidic; green, hydrophobic; white, polar), with an inlay of the backbone structure for reference. The majority of hydrophobic residues cluster on or near the dimer interface, with the two exposed monomeric faces containing long tracts of basic residues. (C) The same surface model overlaid with the estimated mode of selection (blue, purifying; yellow, neutral; red, positive; from [211]). The residues under positive selection centralize on the edges of the basic tract and the nexus at the N- and C-termini.