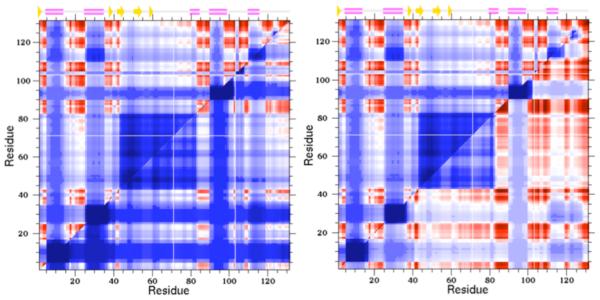
FIGURE 4.
Cooperativity correlation plots identify all pairwise residue-to-residue mechanical couplings within a given protein structure as a specified thermodynamic condition. Blue indicates residue pairs likely to be within the same rigid cluster (as averaged across the thermodynamic ensemble), whereas red indicates residue pairs likely to be within the same correlated motion. White indicates that there is no mechanical coupling between the pair. In each example, the upper triangle corresponds to the wild-type human c-type lysozyme, whereas the lower triangles correspond to two different mutants. In the V100A mutant (left), the structure is rigidified with respect to the wild-type, whereas in the Y45F mutant (right) results in increased flexibility.

