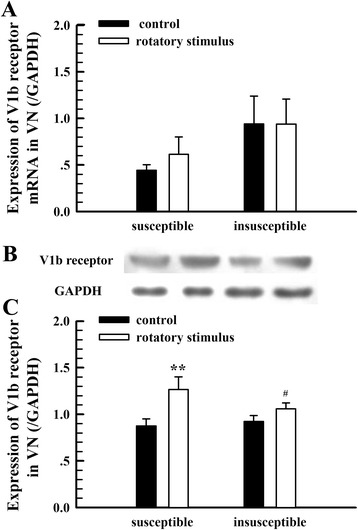
Fig. 4.

The expression of V1bR in the VN with and without rotatory stimulus. a, expression of V1bR mRNA (n = 8). b, examples of the V1bR protein expression. Subgroups correspond to the columns of (a) and (c). c, mean values of the V1bR protein expression (n = 6). ** P < 0.01, vs. control; # P < 0.05, vs. susceptible group after rotatory stimulus
