
Fig. 5.
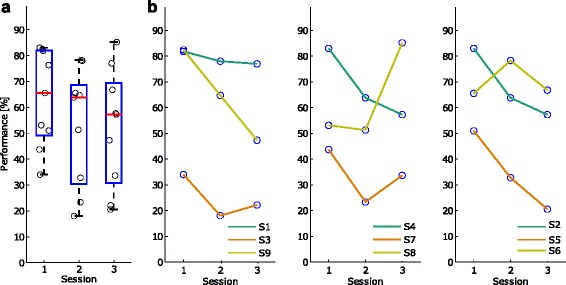
Performance as a percentage of correctly classified trials. Distribution of session-specific performance as a percentage of correctly classified trials for the nine subjects (a) and subject-specific transitions in performance across the three sessions (b). The circles represent the performance of each subject Performance as a percentage of correctly classified trials. Distribution of session-specific performance as a percentage of correctly classified trials for the nine subjects (first panel from the left) and subject-specific transitions in performance across the three sessions (next panels). The circles represent the performance of each subject