
Fig. 8.
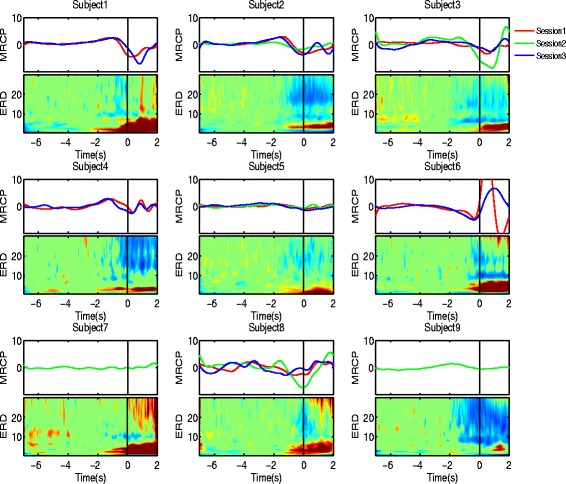
Grand average MRCP (upper subplots) and ERD (lower subplots) on channel Cz over selected sessions for each of the nine subjects. In the upper subplots the ordering of the sessions is marked by the RGB color code (red - session 1, green - session 2, blue - session 3). On the lower subplots, the time-frequency representation shows the ERD across the range of frequencies from 0.1 to 30 Hz. The black vertical line corresponds to the onset of motion