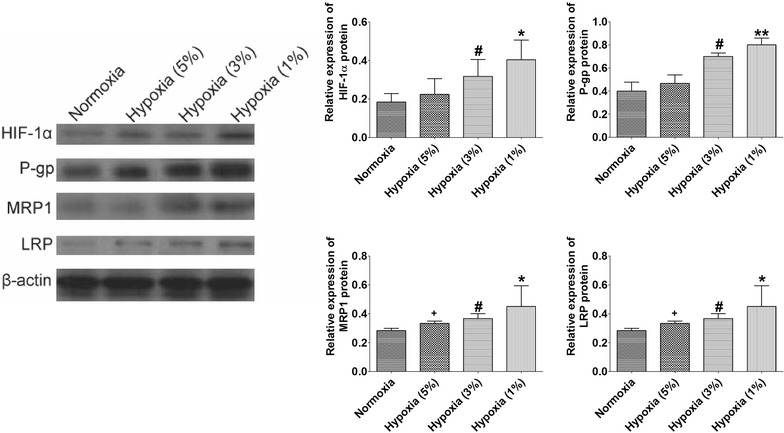
Fig. 4.

Effect of hypoxia on expression levels of HIF-1α, P-gp, MRP1 and LRP protein in HBx-HepG2 cells. Western blot assay was conducted on HBX-HepG2 cells pre-incubated for 48 h in normoxic (21 % O2) or hypoxic (5 % O2, 3 % O2, or 1 % O2) conditions to measure the expression levels of HIF-1α, P-gp, MRP1 and LRP protein, band densities were normalized to β-actin. All data were expressed as mean ± s.e.m., n = 4; significant differences between hypoxia (1 % O2) group and normoxia group were indicated as *P < 0.05, **P < 0.01; significantly differences between hypoxia (3 % O2) group and normoxia group were indicated as # P < 0.05 (One-way ANOVA followed by Bonferroni’s multiple comparison tests)
