Figure 4.

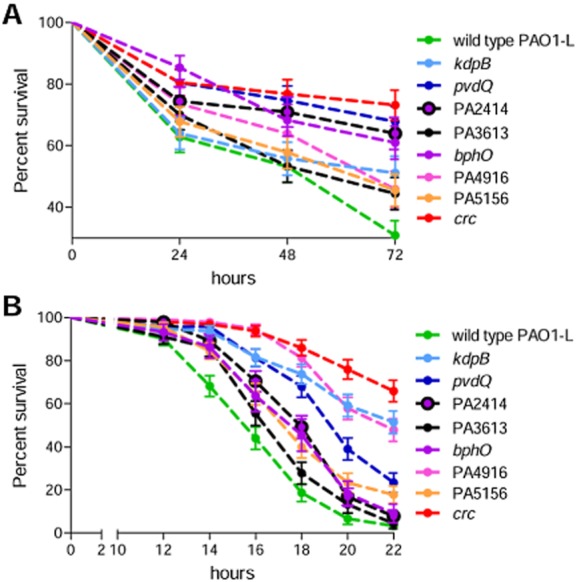
Virulence of P. aeruginosa PAO1-L and selected targets in C. elegans and D. melanogaster disease models. (A) Lethality curves of 72 h in the C. elegans disease model of eight selected Tn5 mutants (kdpB, PA2414, pvdQ, PA3613, bphO, PA4916, PA5156, crc); (B) 22 h lethality curves in D. melanogaster. The results presented here show the mean values and standard errors calculated from three independent experiments.
