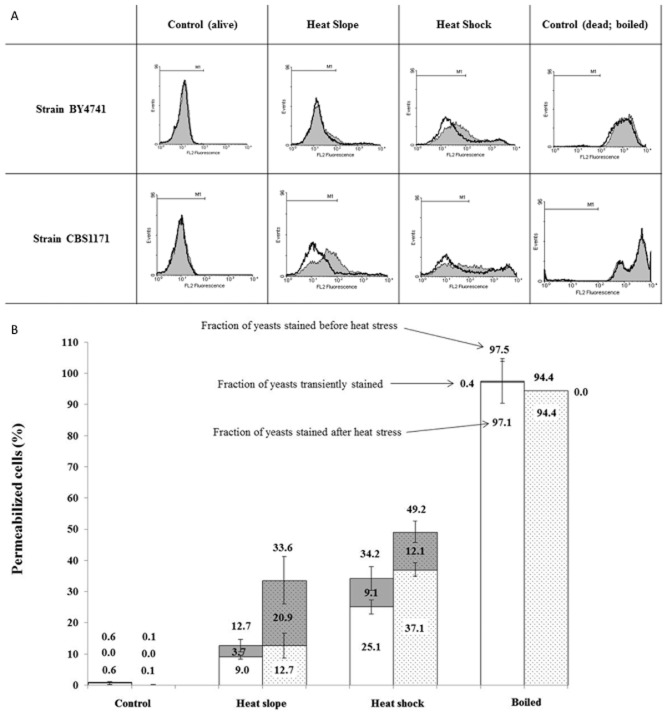
Figure 3.
Flow cytometric analysis of yeast cells stained with propidium iodide as described in Experimental procedures.A. M1 is the region where the fluorescence signal is negative (determined using live cells plus PI). Shaded histograms represent samples in which the PI was added before the heat stress was applied, whereas the black lines represent samples cooled to room temperature prior to addition of the stain.B. To evaluate the fraction of transiently permeabilized yeast cells, the probe was added before or after the heat stress. The fraction of transiently positively stained yeasts corresponds to the difference between the fraction positively stained when PI was added before and after the stress. The first set of histograms (unshaded) represents BY4741 strain and the second set (shaded) represents CBS1171 strain. The fraction of yeasts stained positively corresponds to those outside of the M1 region (see Fig. 3A). Error bars represent 95% confidence intervals.

