Figure 5.

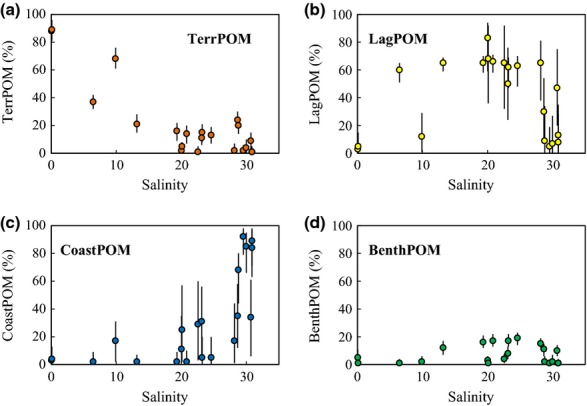
Variations in the relative contributions of different POM sources to water column POM along the salinity gradient. Each plot indicates the median estimated value; error bars show the 95% CIs of the estimated values.

Variations in the relative contributions of different POM sources to water column POM along the salinity gradient. Each plot indicates the median estimated value; error bars show the 95% CIs of the estimated values.