
Figure 7.
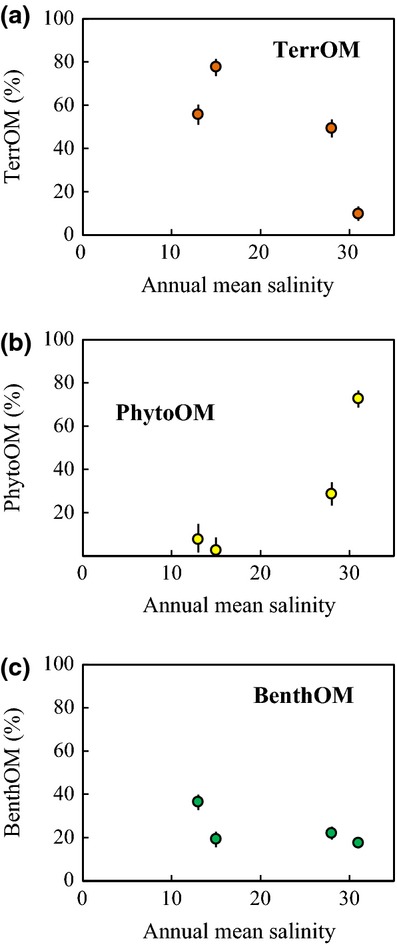
Variations in the relative contributions of different OM sources to sedimentary OM along the salinity gradient. Each plot indicates the median estimated value; error bars show the 95% CIs of the estimated values.
Official websites use .gov
A
.gov website belongs to an official
government organization in the United States.
Secure .gov websites use HTTPS
A lock (
) or https:// means you've safely
connected to the .gov website. Share sensitive
information only on official, secure websites.
Variations in the relative contributions of different OM sources to sedimentary OM along the salinity gradient. Each plot indicates the median estimated value; error bars show the 95% CIs of the estimated values.