Figure 8.

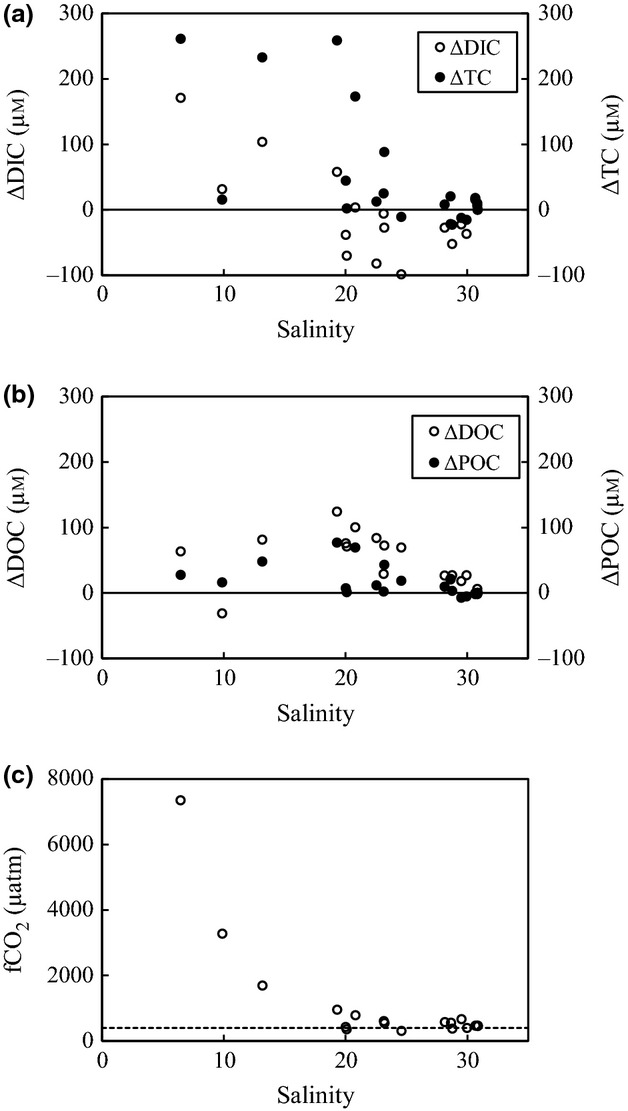
Variations of (a) ΔDIC, ΔTC, (b) ΔDOC, ΔPOC, and (c) fCO2, along the salinity gradient in the Furen Lagoon. Dashed lines indicate the fCO2 of the atmosphere (Tokoro et al., 2014).

Variations of (a) ΔDIC, ΔTC, (b) ΔDOC, ΔPOC, and (c) fCO2, along the salinity gradient in the Furen Lagoon. Dashed lines indicate the fCO2 of the atmosphere (Tokoro et al., 2014).