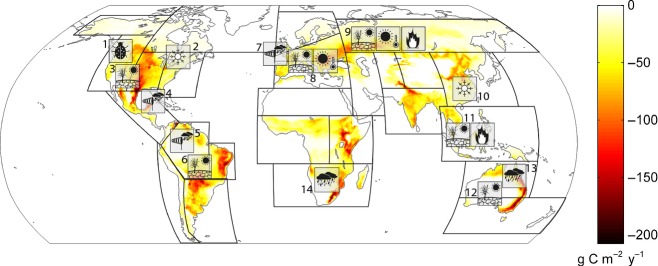
Figure 5.
Global distribution of extreme events in the terrestrial carbon cycle, and approximate geographical locations of published climate extremes with impacts on the carbon cycle. Extreme events in the carbon cycle are defined as contiguous regions of extreme anomalies of GPP during the period 1982–2011 (modified after Zscheischler et al., 2014b). Colour scale indicates the average reduction in gross carbon uptake compared to a normal year due to negative extremes in GPP. Units are gram carbon per square metre per year. The map highlights the IPCC regions with the following references to the published climate extremes. References: 1 pest outbreaks Canada/North America (Soja et al., 2007; Kurz et al., 2008b), 2 ice storm North America (Irland, 2000), 3 drought US (Breshears et al., 2005; Schwalm et al., 2012), 4 heavy storm Southern US (Chambers et al., 2007; Zeng et al., 2009; Negrón-Juárez et al., 2010a), 5 heavy storm Amazon (Negrón-Juárez et al., 2010b), 6 drought Amazon (Tian et al., 1998; Phillips et al., 2009; Lewis et al., 2011), 7 heavy storm Europe (Fuhrer et al., 2006; Lindroth et al., 2009), 8 drought and heat extreme Europe (Ciais et al., 2005; Reichstein et al., 2007), 9 extreme drought, heat and fire in Russia (Barriopedro et al., 2011; Konovalov et al., 2011; Coumou & Rahmstorf, 2012; Bastos et al., 2013a), 10 ice storm China (Stone, 2008; Sun et al., 2012)), 11 fire, drought SE Asia (Page et al., 2002; Schimel & Baker, 2002), 12 drought Australia (Haverd et al., 2013), 13 heavy precipitation Australia (Bastos et al., 2013b; Haverd et al., 2013), 14 heavy precipitation Southern Africa (Bastos et al., 2013b).

