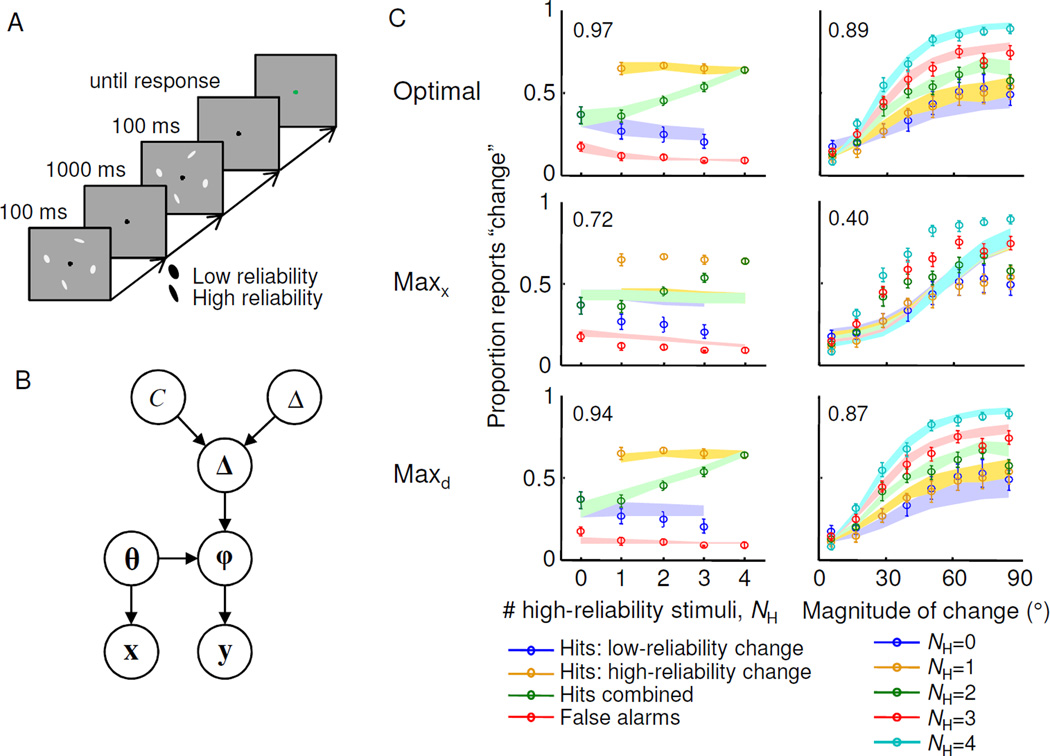
Figure 5. Detection of a single change.
(A) Trial procedure. Stimuli were ellipses, and the reliability of their orientation information was controlled by elongation. Set size was always 4. (B) Generative model (see text). (C) Model comparison for proportion of “change” reports as a function of the number of high-certainty stimuli, NH (left column), and as a function of the magnitude of change, for different values of NH. Circles and error bars: mean and s.e.m. of data. Shaded areas: mean and s.e.m. of model fit. The number in each plot is the R2 of the fit. All panels were adapted from Keshvari et al. (2012).

