Figure 3.

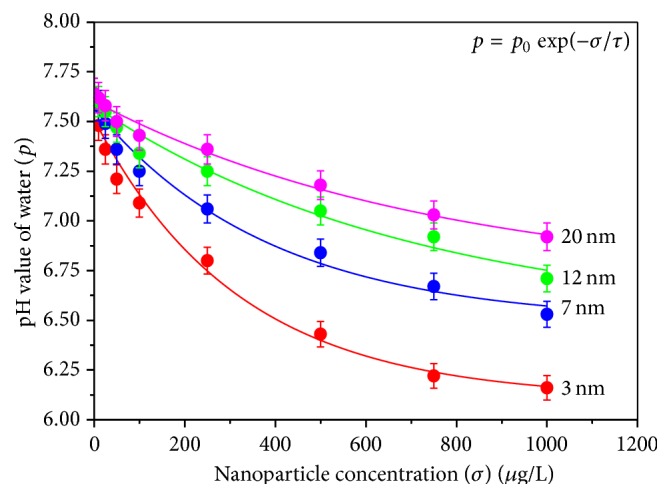
Variation of pH value of water due to exposure of ZnS nanoparticles of different sizes with increasing nanoparticle concentration (σ) for a fixed exposure time (t = 6 days).

Variation of pH value of water due to exposure of ZnS nanoparticles of different sizes with increasing nanoparticle concentration (σ) for a fixed exposure time (t = 6 days).