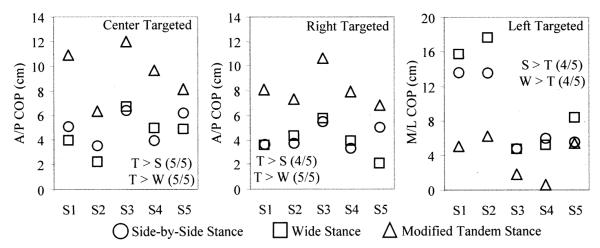
Fig. 6.
COP excursions as a function of reach direction and foot placement. For each subject, the data points represent the COP excursion averaged over three trials for each foot placement. Inequality signs represent group-averaged statistical differences between foot placements for p 0.05. For example, T > S means that the modified tandem stance had a significantly greater center of pressure excursion than the side-by-side stance. The number of subjects that showed individual significance appears within parentheses. (Abbreviations: S1 … S5—subjects one-five; S—side-by-side; W—wide; and T—modified tandem.)

