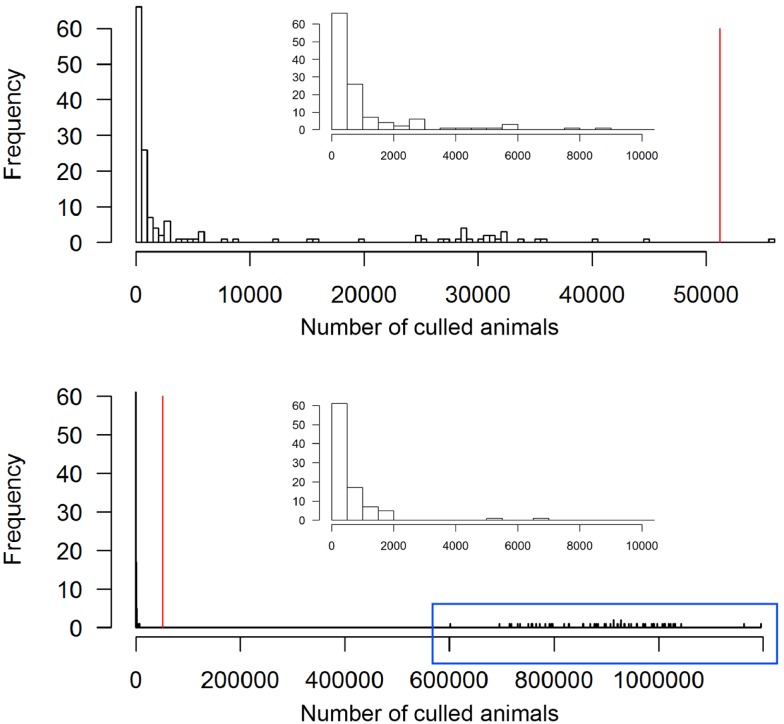
Figure 4.
Total number of culled animals of the 150 simulated FMD outbreaks in the Swiss livestock population in 1965/66 when vaccination was applied (top) and not applied (bottom). The red vertical lines represent the number of culled animals during the real FMD epidemic in Switzerland in 1965/66. The insets zoom into the range of outbreaks with less 10,000 animals culled. The outbreaks in the blue box of the non-vaccination strategy are those referred to as large outbreaks (n = 58).

