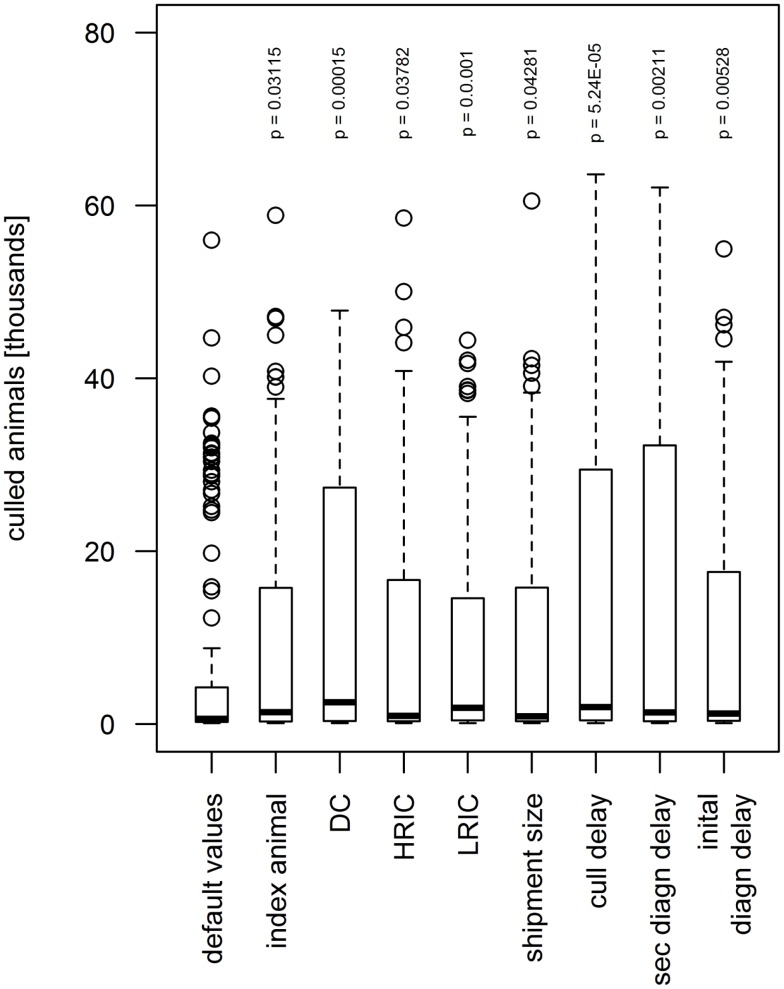
Figure 7.
Influence of model parameters found to be statistically significant (p < 0.05) on simulated number of animals culled during the sensitivity analysis. When increasing the value by 15% above the default value, the number of animals culled augmented. The boxes represent the interquartile range with the median as black line, the whiskers extend to the most extreme data point that is no more than 1.5 times IQR from the box. Index animal, number of animals in the index premises; DC, direct contact frequency; HRIC, high-risk indirect contacts frequency; LRIC, low-risk indirect contact frequency; shipment size, number of animals included in a DC; cull delay, delay between detection and depopulation of infected premises; initial/sec diagn delay, delay between start of clinical signs and detection of FMD on the premises for the index premises and cases, respectively.

