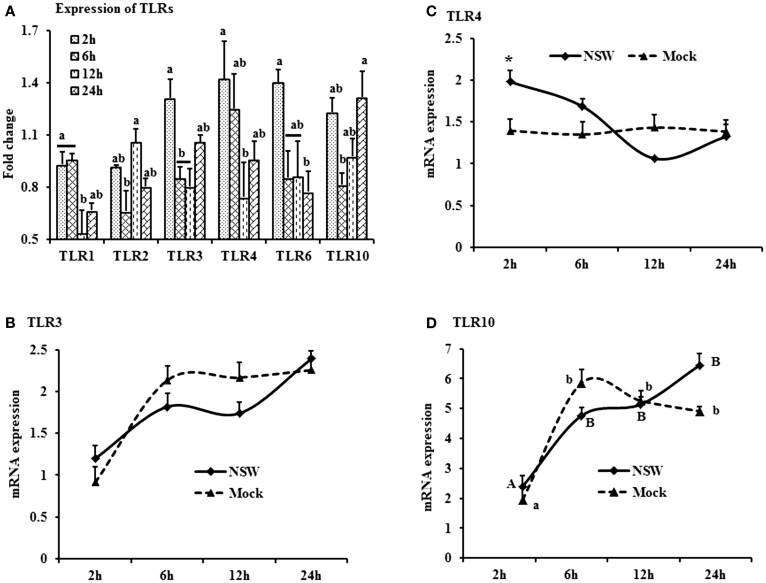
Figure 3.
Differential expression of Toll-like receptor genes in response to West Nile virus. (A) TLrs mRNA expression in fold change. The ΔΔCt (ΔΔCt = ΔCtWNV − ΔCtmock) values were calculated by subtracting the ΔCt of genes in mock-inoculated PBMCs (n = 3). The bar graph showed the expression of genes in WNV-infected PBMCs over mock-inoculated PBMCs (fold change: the normalized expression value of a gene in WNV-stimulated cells/the normalized expression value of a gene in mock-inoculated cells). Bars without common superscripts (a,b; a,c; b,c) denote statistical difference among time points (p < 0.05). (B–D) Relative expression of TLRs mRNA, accounting for the effects of culture conditions on gene transcription in WNV- and mock-inoculated rabbit PBMCs (n = 3). To compare the normalized expression of TLRs genes from PBMCs harvested at each time point to their respective expression levels before either WNV inoculation or mock inoculation, the ΔΔCt values were calculated by subtracting ΔCt of genes in fresh-isolated PBMCs from the ΔCt of genes in WNV- or mock-inoculated PBMCs at each time-point (for WNV-stimulated PBMCs, ΔΔCtWNV = ΔCtWNV − ΔCtfresh; and for mock-inoculated PBMCs, ΔΔCtmock = ΔCtmock − ΔCtfresh). A time-dependent relative expression patterns of (B) TLR3, (C) TLR4, and (D) TLR10 mRNA in WNV-challenged rabbit PBMCs at different time points. Line graphs without common superscript differ significantly (p < 0.05). Upper case letter denotes difference of a gene expression among the time points in WNV-challenged cells; lower case letter denotes difference of a gene expression among the time points in mock-inoculated cells. *indicates the difference of a gene expression between WNV- and mock-challenged cells in the same time point (p < 0.05).

