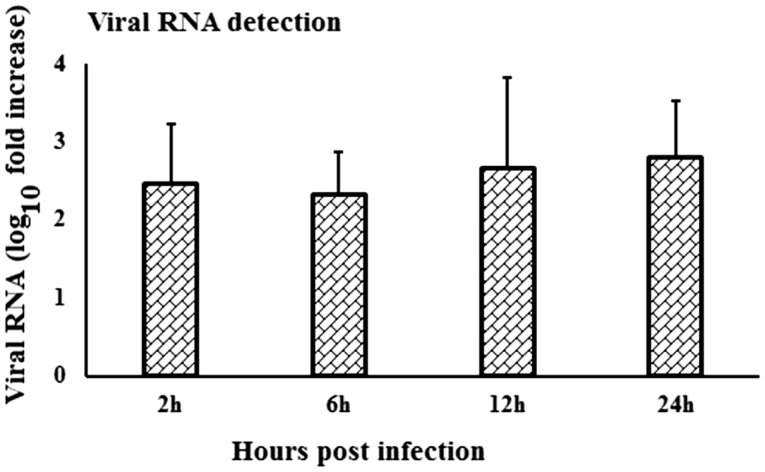
Figure 6.
Kinetics of viral RNA expression in in vitro WNV-infected PBMCs. WNVNSW2011 RNA expression in in vitro virus-infected PBMCs at different time points was been quantified using qRT-PCR. The ΔΔCt (ΔΔCt = ΔCtWNV − ΔCtmock) values were calculated by subtracting the ΔCt of genes in mock-inoculated PBMCs (n = 3). Ct for the mock-inoculated PBMCs (undetected) was set to 40. The bar graph showed the expression of genes in WNV-infected PBMCs over mock-inoculated PBMCs (fold change: the normalized expression value of a gene in WNV-stimulated cells/the normalized expression value of a gene in mock-inoculated cells).

