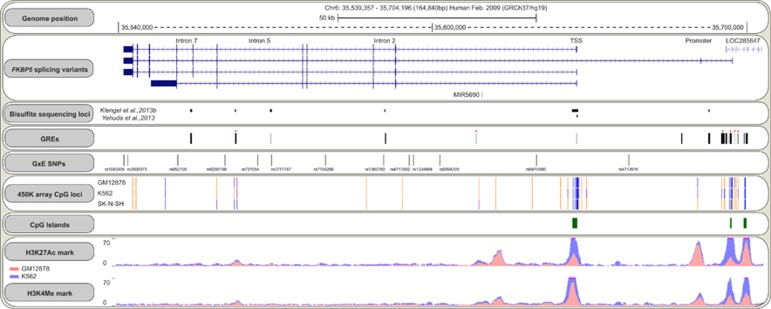
Figure 3.
Schematic overview of key features of the FKBP5 locus. Shown tracks are from the UCSC genome browser (https://genome.ucsc.edu). FKBP5 splicing variants are derived from the RefSeq Genes Track. Bisulfite sequencing loci are shown as a custom track and are based on Klengel et al (2013b) and Yehuda et al (2013). As shown, these CpG sites are distinct from CpGs covered by the Illumina 450K array (shown for two blood cell lines and one neuroblastoma cell line based on ENCODE/HAIB; warm colors, high methylation; cold colors, low methylation levels). Glucocorticoid response elements (GREs) are displayed for A549 and ECC-1 cells and are derived from transcription factor (glucocorticoid receptor) ChIP-sequencing data of the ENCODE project. Conserved GREs are highlighted with red asterisk and are derived from the HMR Conserved Transcription Factor Binding Sites track (z-score cutoff: 1.64). GxE SNPs represent SNPs identified in gene–environment interaction studies and are mapped based on the Common SNPs(142) track (see also Table 1). The H3K27Ac Mark and H3K4Me3 tracks show data from two different blood cells lines derived from the ENCODE project.

