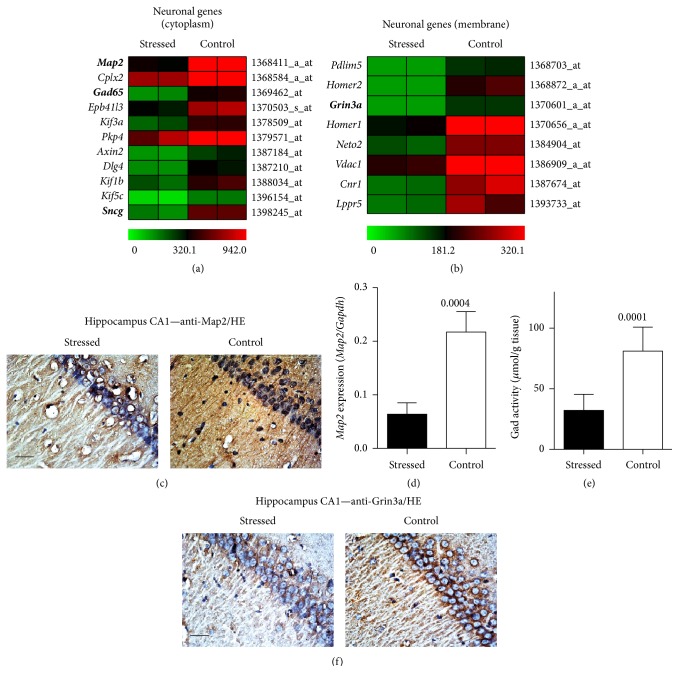
Figure 3.
Whole genome microarray gene expression profiling detected stress-induced signs of hippocampal neurodegeneration. (a) and (b) Whole genome microarray gene expression profiling of hippocampal gene expression documents that stress promoted the significant downregulation of probe sets detecting neuron-specific genes with cytosolic localization (a) or membrane localization (b) according to GO analysis. All probe sets were significantly downregulated in the hippocampus of stressed rats relative to nonstressed controls (P < 0.05 and ≥2-fold difference). The heat map visualizes signal intensities (centered to the median value). (c) Immunohistological detection of Map2 in hippocampal CA1 neurons of a stressed rat (left panel) relative to a nonstressed control (right panel; bar: 20 μm). (d) Hippocampal Map2 expression level was determined by qRT-PCR and is presented as the ratio of Map2/Gapdh expression (±s.d.; n = 4; P = 0.0004). (e) Hippocampal Gad activity of stressed rats relative to nonstressed controls (±s.d.; n = 8; P = 0.0001). (f) The decreased hippocampal Grin3a protein level of a stressed rat (left panel) relative to that of a nonstressed control (right panel) was detected by immunohistology in hippocampal CA1 neurons; bar: 20 μm. Immunohistology data are representative of 4 rats/group ((c) and (f)).

