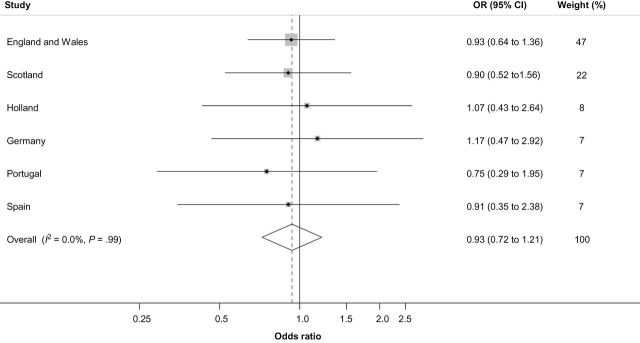
Figure 1.
Forest plot of association between OGG1 c.923A and colorectal cancer risk. Studies were weighted according to the inverse of the variance of the log of the odds ratio (OR) calculated by unconditional logistic regression. Meta-analysis under a fixed-effects model was conducted using standard methods. Cochran’s Q statistic to test for heterogeneity and the I 2 statistic to quantify the proportion of the total variation due to heterogeneity were calculated. Horizontal lines indicate 95% confidence intervals (CIs). Boxes indicate odds ratio point estimate; its area is proportional to the weight of the study. Diamond (and broken line) indicates overall summary estimate, with confidence interval given by its width. Unbroken vertical line indicates null value (OR = 1.0). Risk allele frequencies are shown in square brackets.

