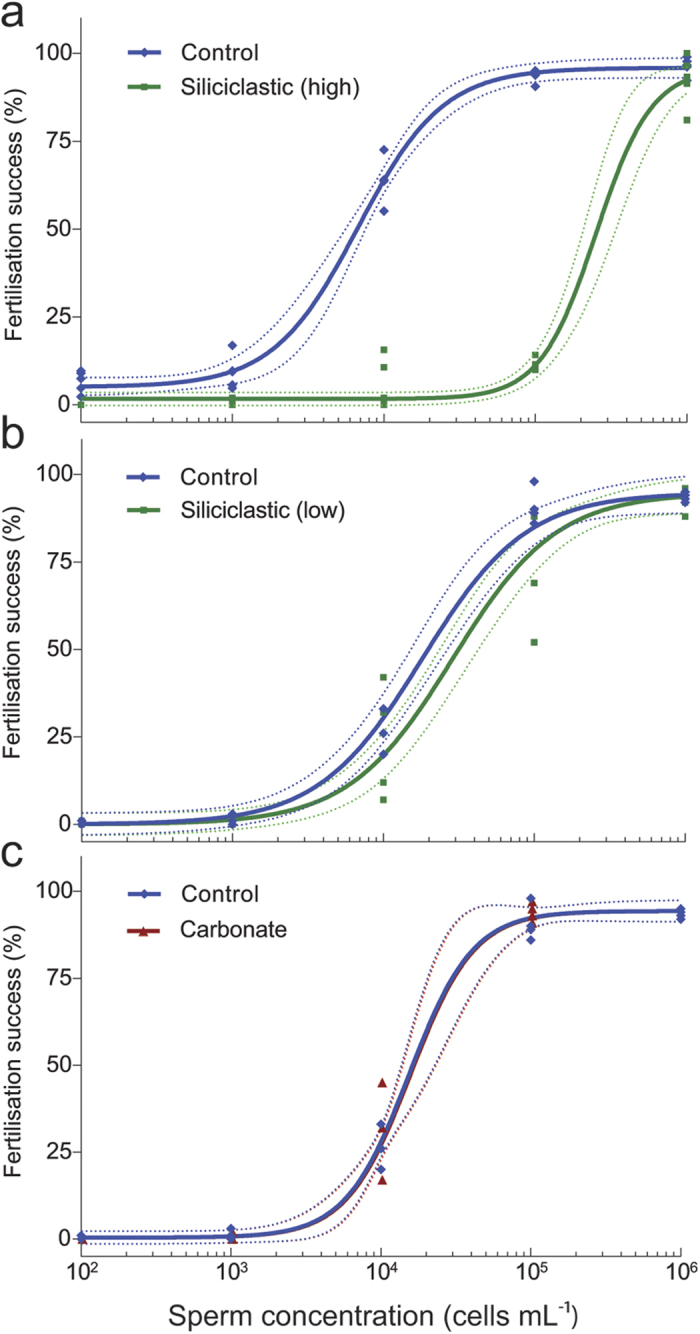
Figure 3. Acropora tenuis fertilisation success (%) curves fitted to four-parameter logistic models plotted over a range of sperm concentrations (102–106 sperm mL−1).

(a) Siliciclastic (high): 705 mg L−1 , green; control: 0 mg L−1, blue and (b) siliciclastic (low): 230 mg L−1, green; control: 0 mg L−1, blue) and (c) carbonate: 230 mg L−1, red; control: 0 mg L−1, blue) suspended solid sediment concentrations. Dashed lines represent 95% confidence bands.
