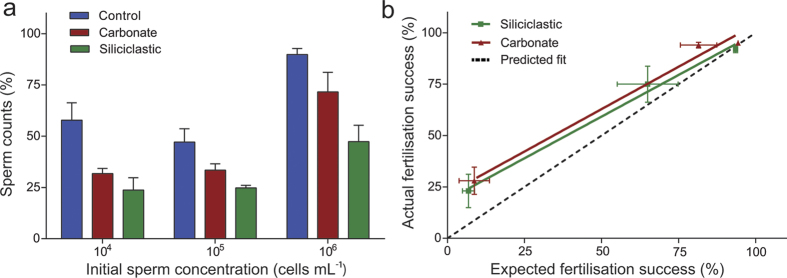
Figure 4.
(a) Bar chart of Acropora tenuis sperm counts (means ± SE) in the water’s surface (top 1 cm) as a proportion of the initial sperm concentration after 30 minutes exposure to suspended sediments (230 mg L−1). n = 3. (b) Means (SE) of interpolated sperm counts (expected) with fertilisation success data (actual).

