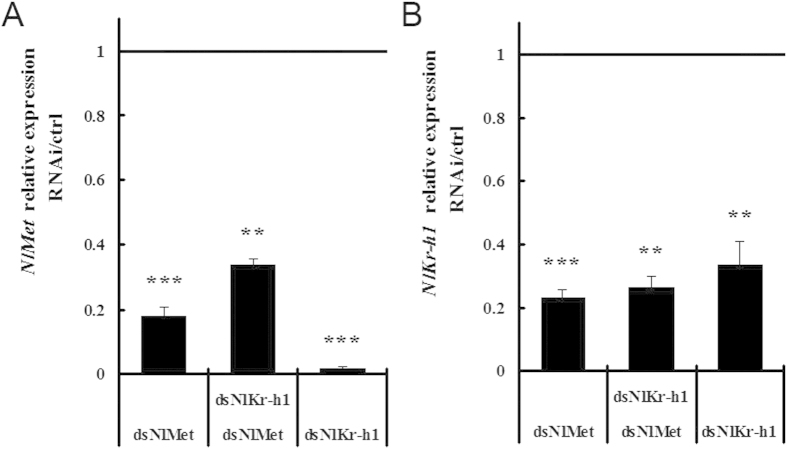
Figure 7. Relative expression levels of NlMet and NlKr-h1 three days after gene silencing of NlMet or NlKr-h1 or both in 5th instar larvae of N. lugens.
(A) NlMet; (B) NlKr-h1. The level of significance is based on t-tests, *P < 0.01, and error bars represent the standard error of the difference (SED).

