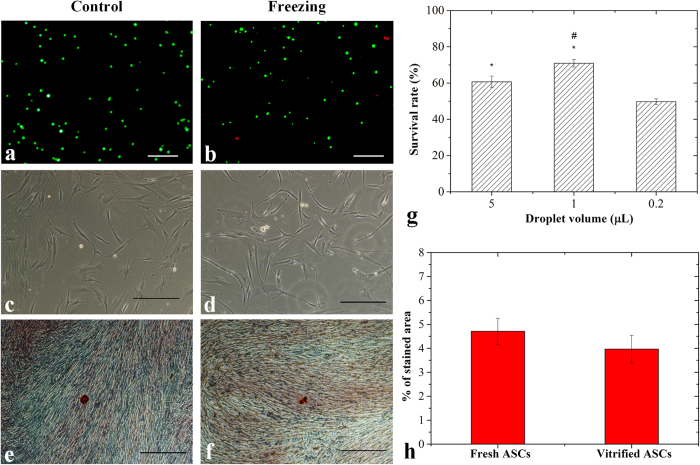
Figure 4. The hASCs droplets frozen on non-contact vitrification device.
Before freezing: (a) Representative fluorescent images of hASCs; (c) Undifferentiated cells; (e) Differentiated cells; After freezing: (b) Representative fluorescent images of hASCs (green: live cells; red: dead cells); (d) Undifferentiated cells; (f) Differentiated cells; (g) Survival rate of hASCs frozen in various droplet volumes; (h) Alizarin Red stained area analysis. (Scale bar: 100 μm). *indicates p < 0.05 relative to 0.2 ul droplet; #indicates p < 0.05 relative to 5 ul droplet.

