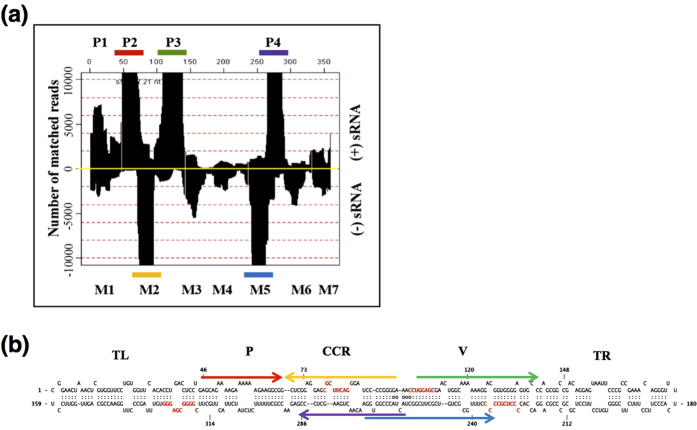
Figure 1. Profiling of PSTVd-sRNA for the determination of the sRNA producing hotspots.
(a) During replication, PSTVd forms an RNA/RNA duplex which is believed to induce RNA silencing. The high-throughput sequence data obtained from tomato plants infected with PSTVd variants was mapped against the full-length PSTVd genome (1 to 359 from left to right). The upper panel indicates accumulated PSTVd-sRNA reads derived from the genomic (+) strand, and the lower panel indicates those from the antigenomic (−) strand. The profile revealed the presence of at least four PSTVd-sRNA producing hotspots on (+) strand, P1, P2, P3 and P4, and at least seven hotspots on (−) strand, M1, M2, M3, M4, M5, M6 and M7. Out of these, five regions were considered as ‘major hotspots’ as they tend to produce at least 20% of the total PSTVd-sRNA. The colored bars show these major hotspots. (b) Major hotspot regions were plotted on the predicted secondary structure of PSTVd. The arrow indicates the direction of the PSTVd-sRNA on the PSTVd genome. The arrows in red, green and purple represent PSTVd-sRNA hotspot regions derived from the genomic (+) strand, while the arrows in yellow and blue denote those derived from the antigenomic (−) strand.

