
Figure 4. Gel blot analysis of PSTVd-sRNA production in the selected transgenic N. benthamiana plants.
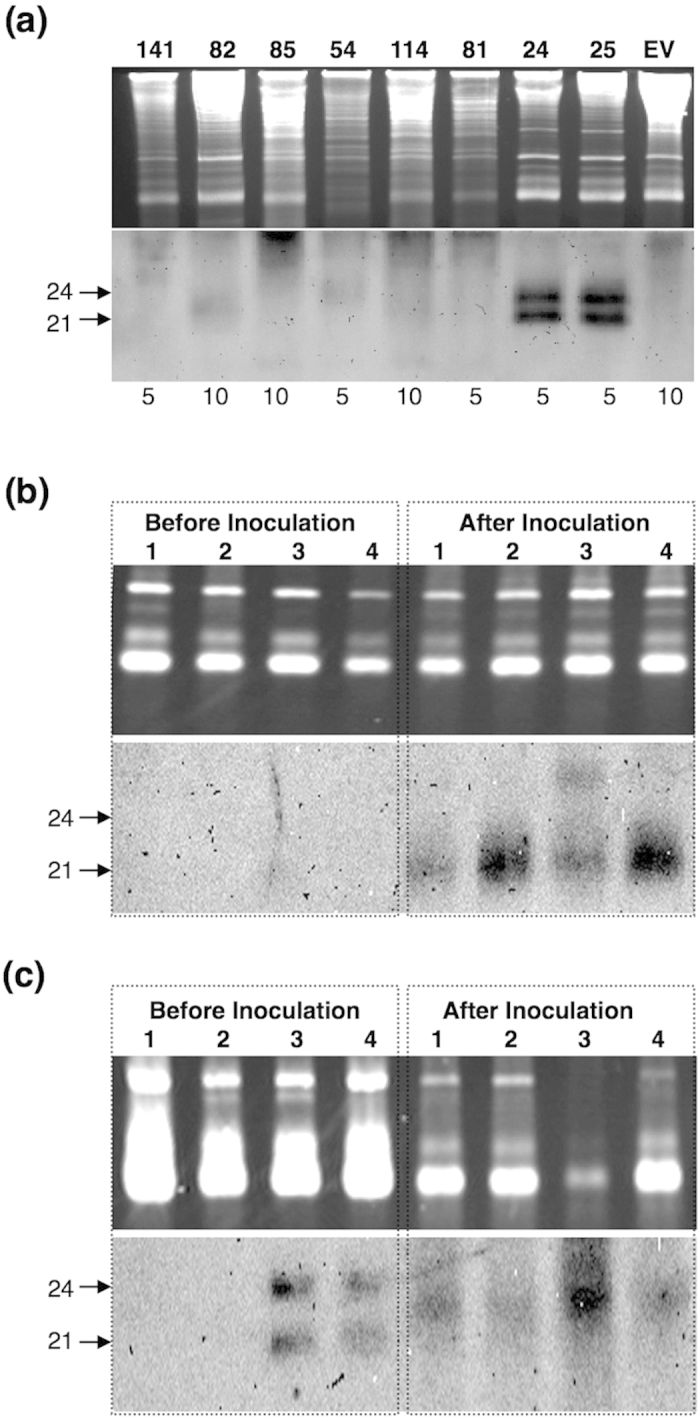
(a) In order to evaluate the amount of PSTVd-sRNA produced by each transgenic line, the samples were collected prior to infection assay and were analysed by gel-blot hybridisation assay using DIG-labelled PSTVd-riboprobe. The upper panel represents the ethidium bromide stained 12% PAGE containing 8M urea. Lane 141 hpPSTVd:∆TLE-141, Lane 82 hpPSTVd:∆P-82, Lane 85 hpPSTVd:TL-85, Lane 54 hpPSTVd:Puppo-54, Lane 114 hpPSTVd:CCRuppo-114, Lane 81 hpPSTVd:CCRdopo-81, Lane 24 hpPSTVd:257a-24, Lane 25 hpPSTVd:257a-25 and Lane EV Empty vector. The numbers below each lane represent the μg of RNA charged per lane. To demonstrate the production of sRNA by PSTVd upon infection, the samples were collected both before and after the PSTVd infection assay and were analysed by gel-blot hybridisation assay using DIG-labelled PSTVd-riboprobe after separation on 12% PAGE containing 8M urea. (b) Lane 1 Empty vector, Lane 2 hpPSTVd:∆TLE-24, Lane 3 hpPSTVd:∆TLE-32 and Lane 4 hpPSTVd:∆TLE-141. (c) Lane 1 Empty vector, Lane 2 hpPSTVd:257a-60, Lane 3 hpPSTVd:257a-24 and Lane 4 hpPSTVd:257a-25.