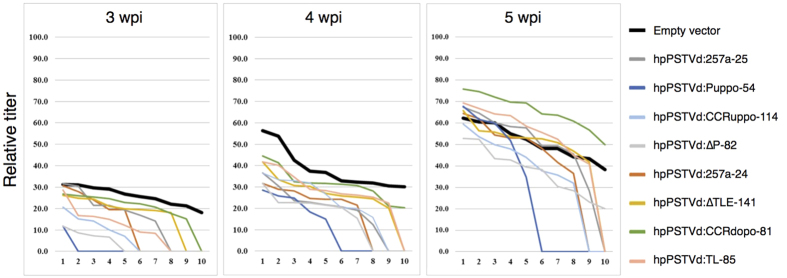
Figure 5. Evaluation of resistance in the selected N. benthamiana transgenic lines against PSTVd infection.
Ten plants each of the selected eight transgenic N. benthamiana lines (hpPSTVd:∆TLE-141, hpPSTVd:∆P-82, hpPSTVd:TL-85, hpPSTVd:Puppo-54, hpPSTVd-CCRuppo-114, hpPSTVd:CCRdopo-81, hpPSTVd:257a-24 and hpPSTVd:257a-25), as well as Empty vector control inoculated with PSTVd, were analysed by gel-blot hybridisation in order to detect the number of plants infected and to determine the relative accumulation levels of PSTVd in each plant at the intervals of 3-, 4- and 5-wpi. The vertical axis indicates the relative PSTVd accumulation levels in the infected plants using a PSTVd-positive control as 100. The horizontal axis indicates plants number 1–10 of each line, from the one showing the highest PSTVd accumulation level to that with the lowest. Those with accumulation level 0 indicate the plants in which PSTVd accumulation level was lower than the current detection limit. The thick black line indicate the Empty vector control. The lines hpPSTVd:Puppo-54, hpPSTVd:∆P-82, hpPSTVd:257a-24, hpPSTVd:257a-25 and hpPSTVd:CCRuppo-114 showed relatively strong resistance. The PSTVd accumulation level was suppressed until 4-wpi in these lines.

