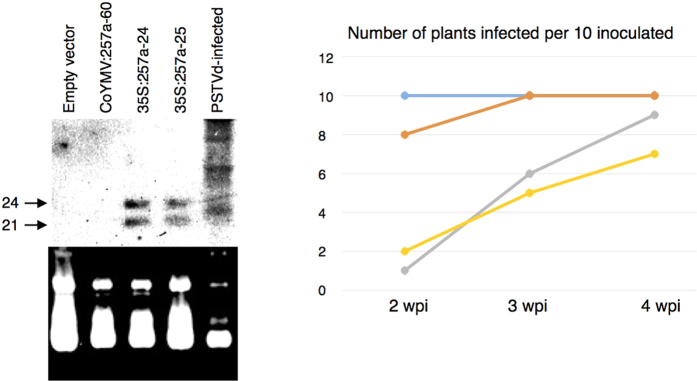
Figure 6. Effect of the promoter on the expression of PSTVd-sRNA and on the resistance against PSTVd in the T3 generation.
(a) Three N. benthamiana transgenic lines expressing hpPSTVd:257a under the control of either the CaMV-35S (hpPSTVd:257a-24 and -25) or the CoYMV (hpPSTVd:257a-60) promoters were analysed for the expression of PSTVd-sRNA before inoculation by gel-blot assay. The upper panel indicates gel-blot hybridisation analysis of PSTVd-sRNA. The arrows indicate PSTVd-sRNA of 24- (upper) and 21- (lower) nucleotides. The lower panel indicates the image of 12% PAGE containing 8M urea stained with ethidium bromide. The arrow indicates t-RNA. The lines under the control of the 35S-promoter accumulated abundant PSTVd-sRNA with the sizes of 24- and 25-nucleotides. (b) Ten plants each of the transgenic N. benthamiana lines (hpPSTVd:257a-24, -25, and hpPSTVd:257a-60) were challenge-inoculated with PSTVd and the infection analysed at 2-, 3- and 4-wpi. The numbers of plants infected were plotted. The lines under the control of the 35S-promoter expressing abundant PSTVd-sRNA showed resistance to PSTVd infection. In the graph, the blue line indicates empty vector, the orange hpPSTVd:257a-60 line, the grey hpPSTVd:257a-24 and the yellow line hpPSTVd:257a-25, respectively.

