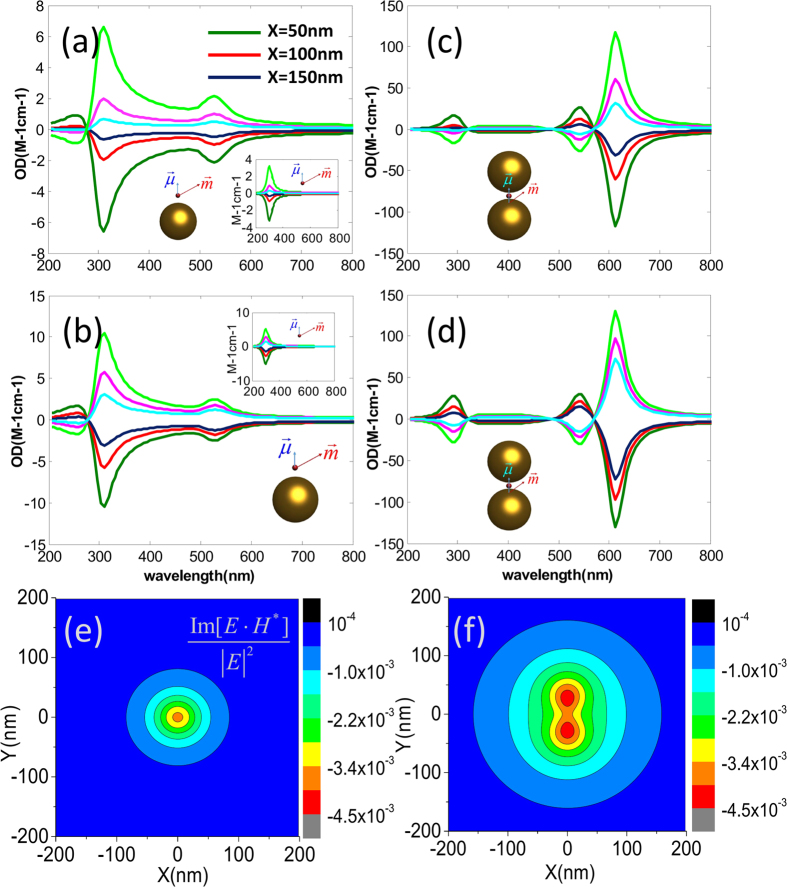
Figure 2.
Orientation averaged OD as a function of wavelength under the OAM incident beam when the nanocomposites locate at  (olive line),
  (red line) and
  (blue dark line), respectively. The corresponding signals for the mirror reflected system are presented as green (
 ), pink (
 ), blue (
 ). (a,b) correspond to the system of a metal nanoparticle and chiral molecule with
  and
and  , respectively. (c,d) to the system of a NP dimer and a chiral molecule with
  and
and  , respectively. (e,f) describe
  as a function of position for the incident OAM beam with
  and
and  at the wavelength of 300 nm, respectively.

