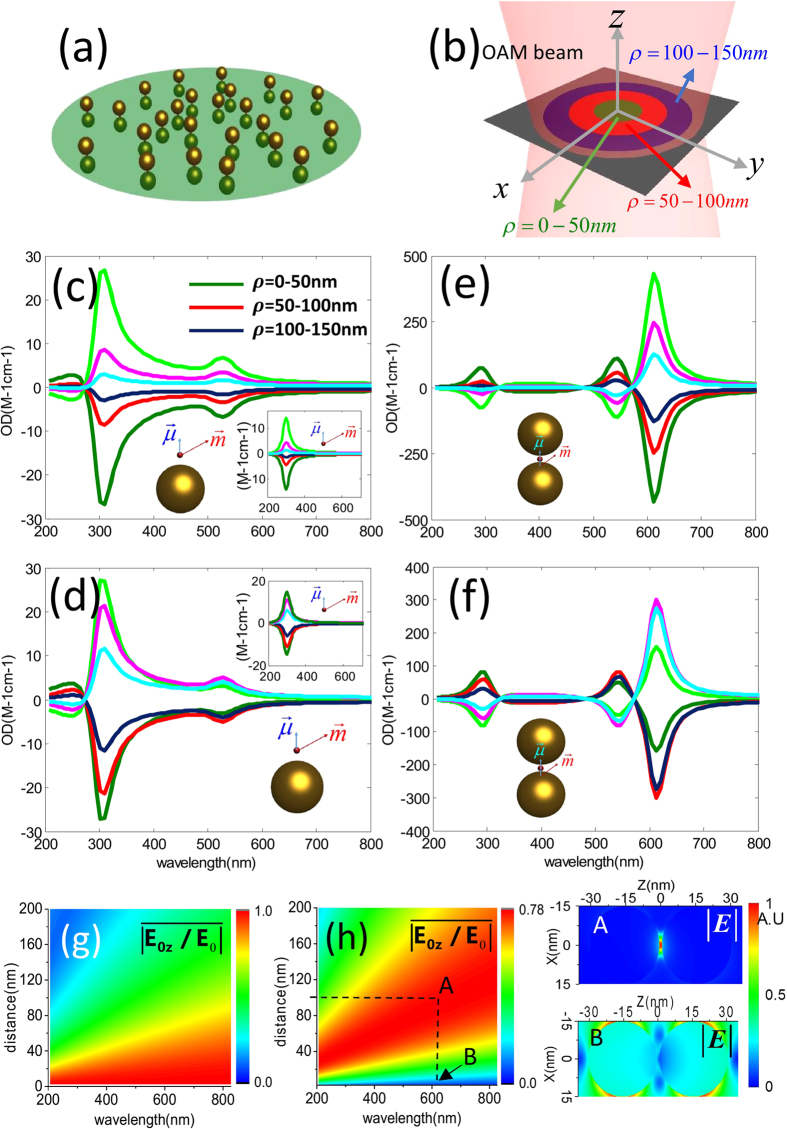
Figure 4.
(a) The distribution of nanocomposites with fixed orientations in a circular region. (b) Schematics of the OAM beam and the regions being considered. The green region marks = 0–50 nm, red region corresponds to ρ = 50–100 nm, blue region to ρ = 100–150 nm. (c,d) Orientation fixed OD averaged in some regions as a function of wavelengths for a metal nanoparticle and a chiral molecule under the OAM incident beam with  and
and  , respectively. The insets represent the corresponding results for the single chiral molecule without NPs. (e,f) Orientation fixed OD averaged in some regions as a function of wavelengths for the Au dimer and a chiral molecule under the OAM incident beam with
  and
and  , respectively. The olive/red/dark blue lines correspond to the signals in
  = 0–50 nm/
 = 50–100 nm/
 = 100–150 nm regions. The corresponding signals for the mirror reflected system are presented as green/pink/blue lines. (g,h) Averaged relative values of the longitude electric field magnitude as a function of the relative distances between the center of the x-polarized OAM beam and nanocomposites for the case with
  and
and  , respectively. Panel A: electric field distribution for a dimmer when the molecule is put at
  in the focal plane; Panel B: electric field distribution for a dimmer when the molecule is put at the center of the beam. The other parameters are taken identical with those in Fig. 1.

